Arabic Keywords Search Intent With Python

Search intent means knowing what your users are looking for or interested in. knowing that will help you develop a better content plan and strategy.
Optimizing your content for user's search intent is very important for Arabic SEO since Google's new updates are doing a great job understanding the Arabic text. Not only for articles websites, even for e-commerce, classifieds, and restaurants websites.
How to Get The Search Intent For Arabic Keywords
First of all, you need to know the intent behind your website's content. this will help you to learn more about your users and to optimize your content according to them.
The search intent in the Arabic language is similar to any other language since we are all humans and have the same needs.
The main difference in the Arabic language is synonymous. Each country has its own words to describe things and events, and sometimes in the same region, there are many synonyms for the same word or term.
Example of Arabic Synonymous From Different Countries
| Jordan | Egypt | Saudi Arabia | English |
| خلوي | موبايل | جوال | Mobile Phone |
| سيارة | عربية | موتر | Car |
| كوشوك | كاوتش | كفر | Tyre |
How to Define Your Arabic Keywords Search Intent Groups
Before starting with the code, you need to define the search intent in groups by getting your keywords from Google Search Console or other SEO tools.
The easiest way is to use an add-on on Google Sheets called Search Analytics for Sheets.
How to install and use Search Analytics for Sheets Add-on
- Go to your Google drive and open a new Google sheet.
- Click on Add-ons, then Get Add-ons.
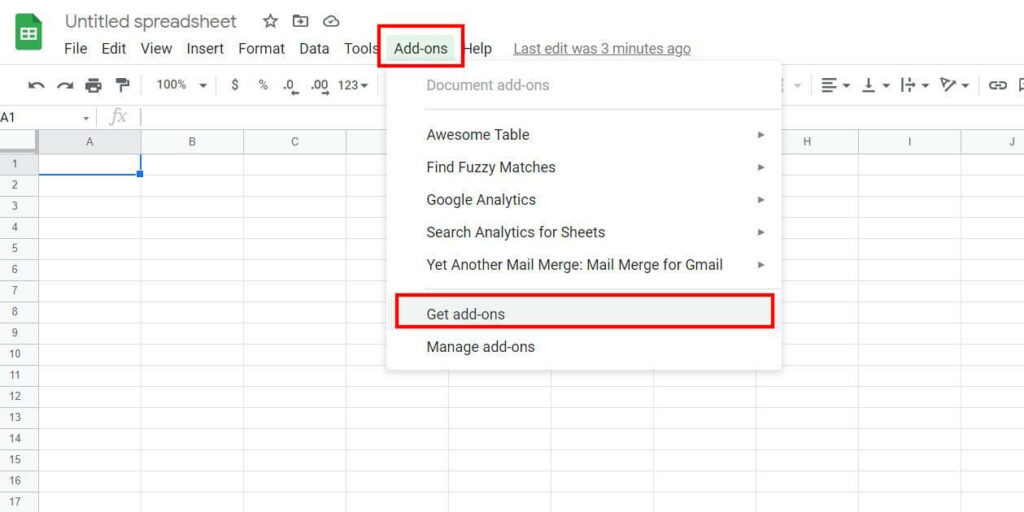
- Type Search Analytics for Sheets in the search bar and install the add-on
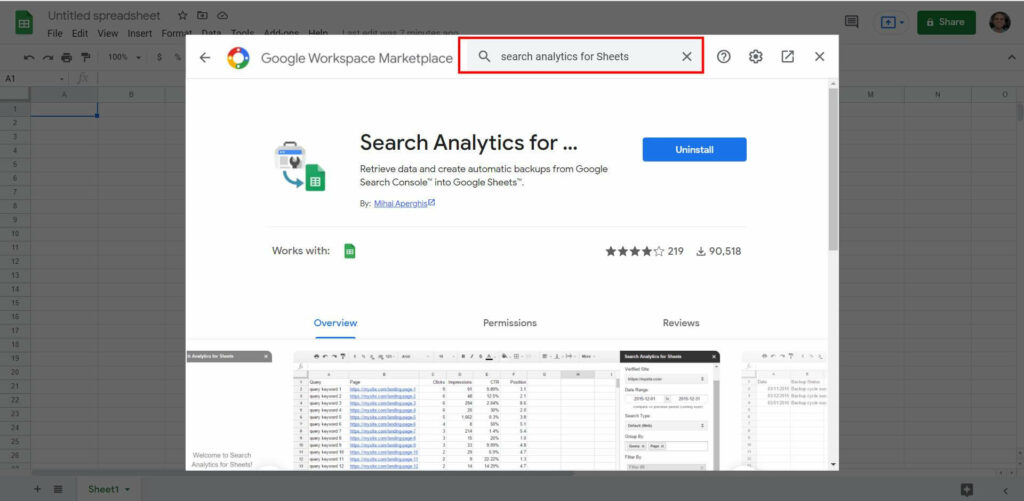
- After installing the add-on, you will find a new item under Add-on "Search Analytics for Sheets" and click on Open Sidebar.
Requesting the Data from Google Search Console
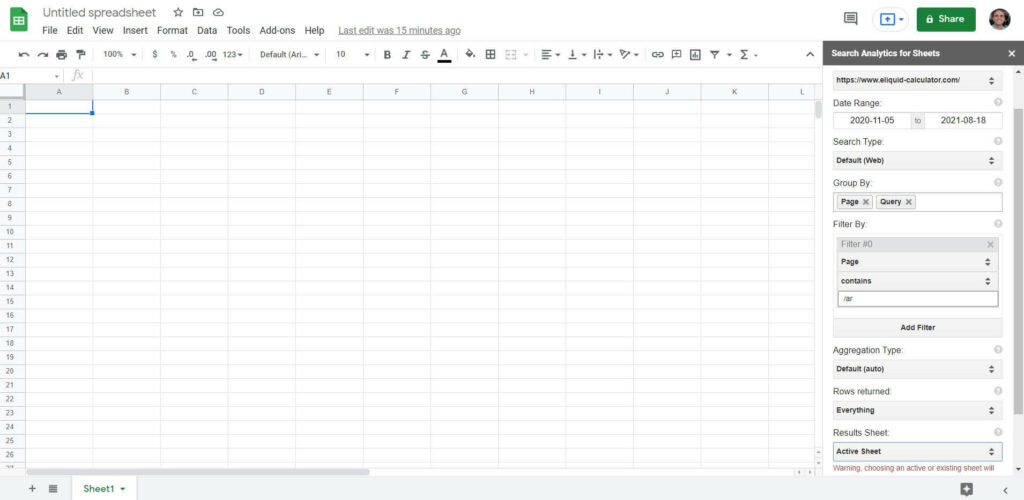
- Under Verified websites, choose the website that you want to get its data.
- Set the date range to be the last 16 months.
- Grouped by field, select page, and query.
- In my case, I have three languages on my website, so I set a filter on Page to get only the URLs containing "/ar".
- Set the Rows Returned to everything; this option will get you all the data.
- Set the last fields to Active Sheet if you want to retrieve the data in the current tab.
- Click on Request Data.
Classify Search Intent in Groups
After getting the whole keywords for the last 16 months, it's time to prepare the groups of intents before importing the data to our Python script. This is manual work where you need to look at your keywords and classify them into groups.
In this example, the website is a calculator for e-liquid DIY mixing, where most of the keywords are about flavors, how to, prices, where to buy, and types.
In the same Google Sheet, open a new tab and use the first column for the intent and the second for words that describe the intent. Then start adding the intent groups and their words as shown below.
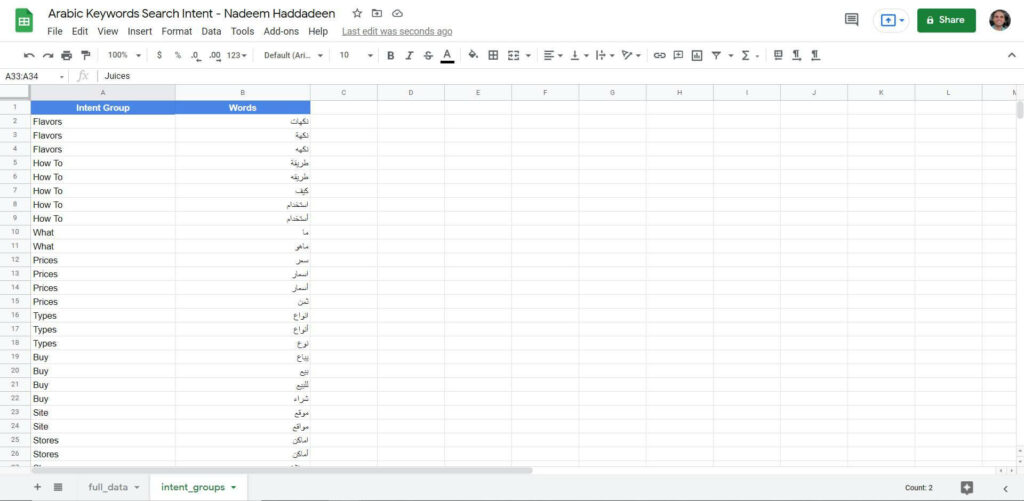
Don't forget to add all the variations of the words, especially for the words that end with ة,ه,ا,أ,ى,ي
Get the Search Intent for Arabic Keywords Using Python
- Download the intent group and Google Search Console sheets in CSV files.
- In your script folder, create two folders, one for the source data and the other for the results.
- Place your search intent and google search console data in the source folder.
- Open Jupyter notebook and follow the below script.
Reading the Data
First, you need to import the Pandas library to read your CSV files.
import pandas as pdRead the CSV files and store them in data frames.
intent_data = pd.read_csv("source/intent_groups.csv")
gsc_data = pd.read_csv("source/gsc_data.csv")
Convert the search intent terms into a list
intent_words_list = intent_data["Words"].values.tolist()Define a function to extract the Arabic search intent for each keyword
def get_intent(keyword,intent_words_list,intent_data):
    for kw in keyword.split():
        if kw in intent_words_list:
            intent_group = intent_data.loc[intent_data["Words"] == kw]
return intent_group["Intent Group"].values[0]Add a new column in our Google Search Console data frame for the search intent, and apply a lambda function to get the intents.
gsc_data["Search Intent"] = gsc_data["Query"].apply(lambda keyword : get_intent(keyword,intent_words_list,intent_data))Display the final results.
display(gsc_data)Save the results into a CSV file.
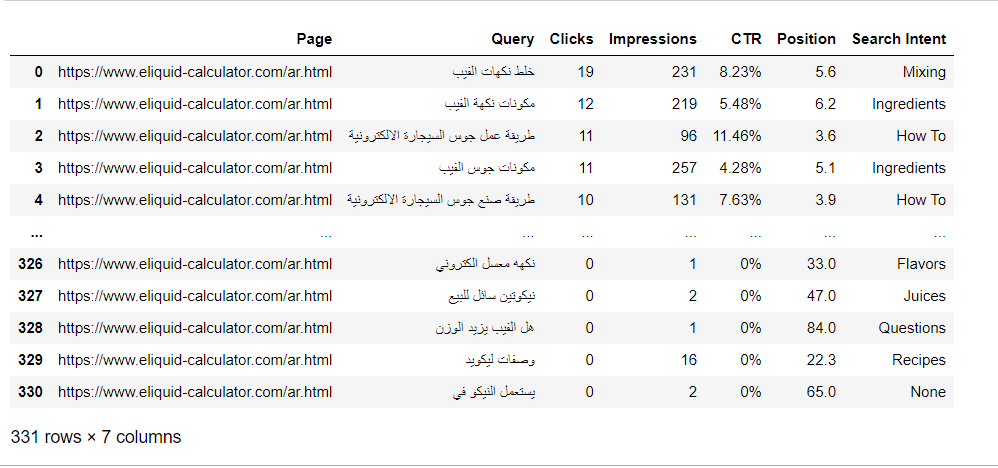
gsc_data.to_csv("results/arabic-search-intent.csv", index = False)Now we have a new column named Search Intent, where we have each keyword assigned to a search intent group.
Analyzing Arabic Keywords Search intent
To understand your users and the intent behind their questions, we need to perform some data analysis using Python to get more insights before deciding on our content plan.
Here we will use the matplotlib library to perform a simple data analysis using bar charts.
import matplotlib.pyplot as plt
from matplotlib.pyplot import figure
We need to know how many clicks each intent group is driving clicks to our website.
intents_groups = gsc_data.groupby("Search Intent").sum()
intents_groups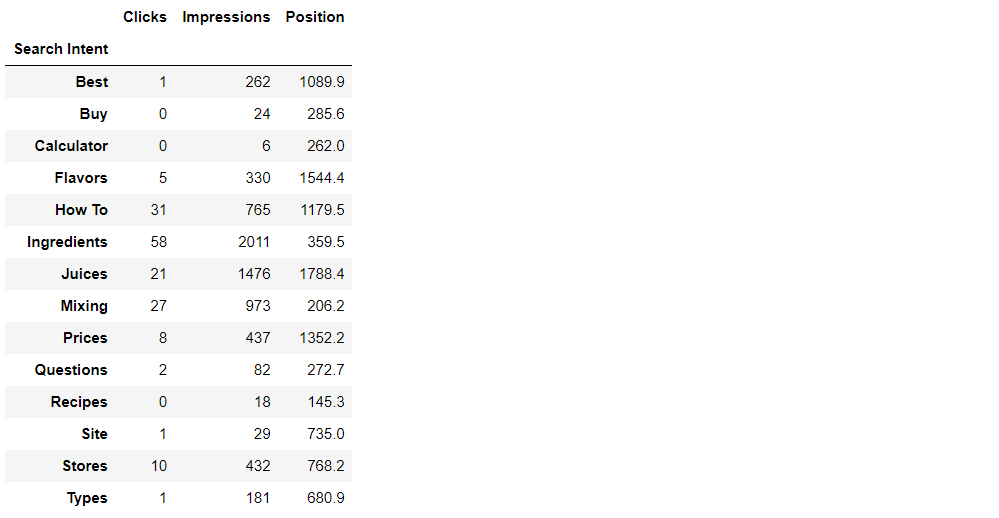
From the above table, we can see that the ingredients intent group is the most group that drives clicks to our website. To visualize the data, we will use the bar chart.
intent_group_labels = [intent for intent, gsc_data in intents_groups.groupby(["Search Intent"])]
plt.bar(intent_group_labels,intents_groups["Clicks"])
plt.xticks(intent_group_labels,rotation="vertical",size=12)
plt.show()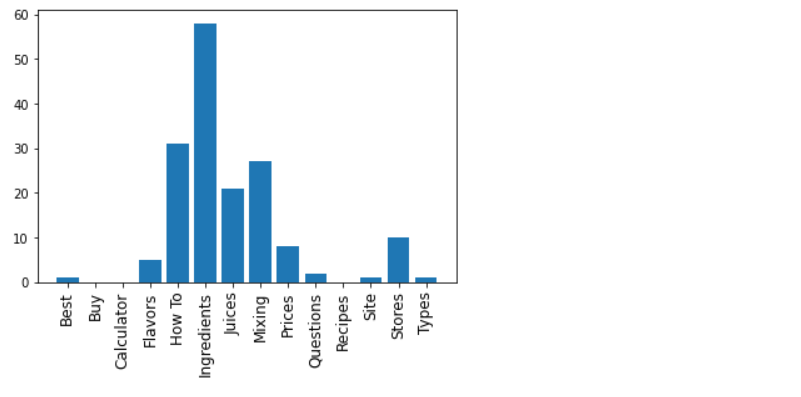
The second chart will be for the impressions
plt.bar(intent_group_labels,intents_groups["Impressions"])
plt.xticks(intent_group_labels,rotation="vertical",size=12)
plt.show()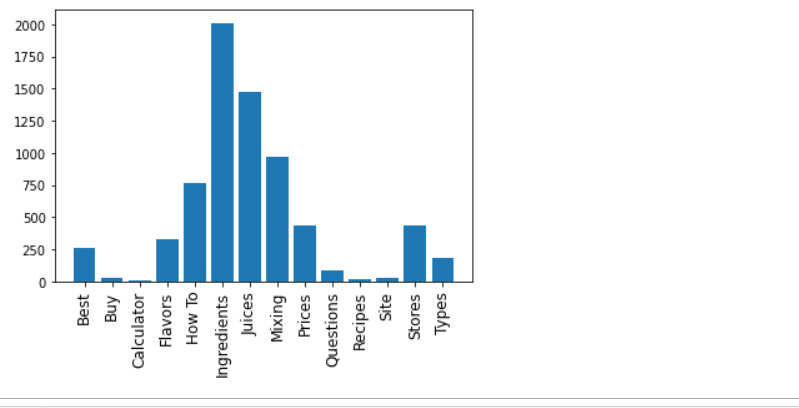
As you can see, the ingredients group is still the most group that drives impressions to our website. And the interesting thing here is that the Calculator intent group is one of the least groups that drive clicks and impressions. This indicates that we have something missing with our content since it's the website's primary purpose.
Of course, you can do more advanced analysis on Excel or Google Sheet to start making decisions about your content and website pages.
You can find the complete script on Google Colab.


